 PayMyDine
Revenue
Compare revenue by period, service window, channel or location where the configured data supports it.
Compare sales, guest demand, table turnover and profitability.
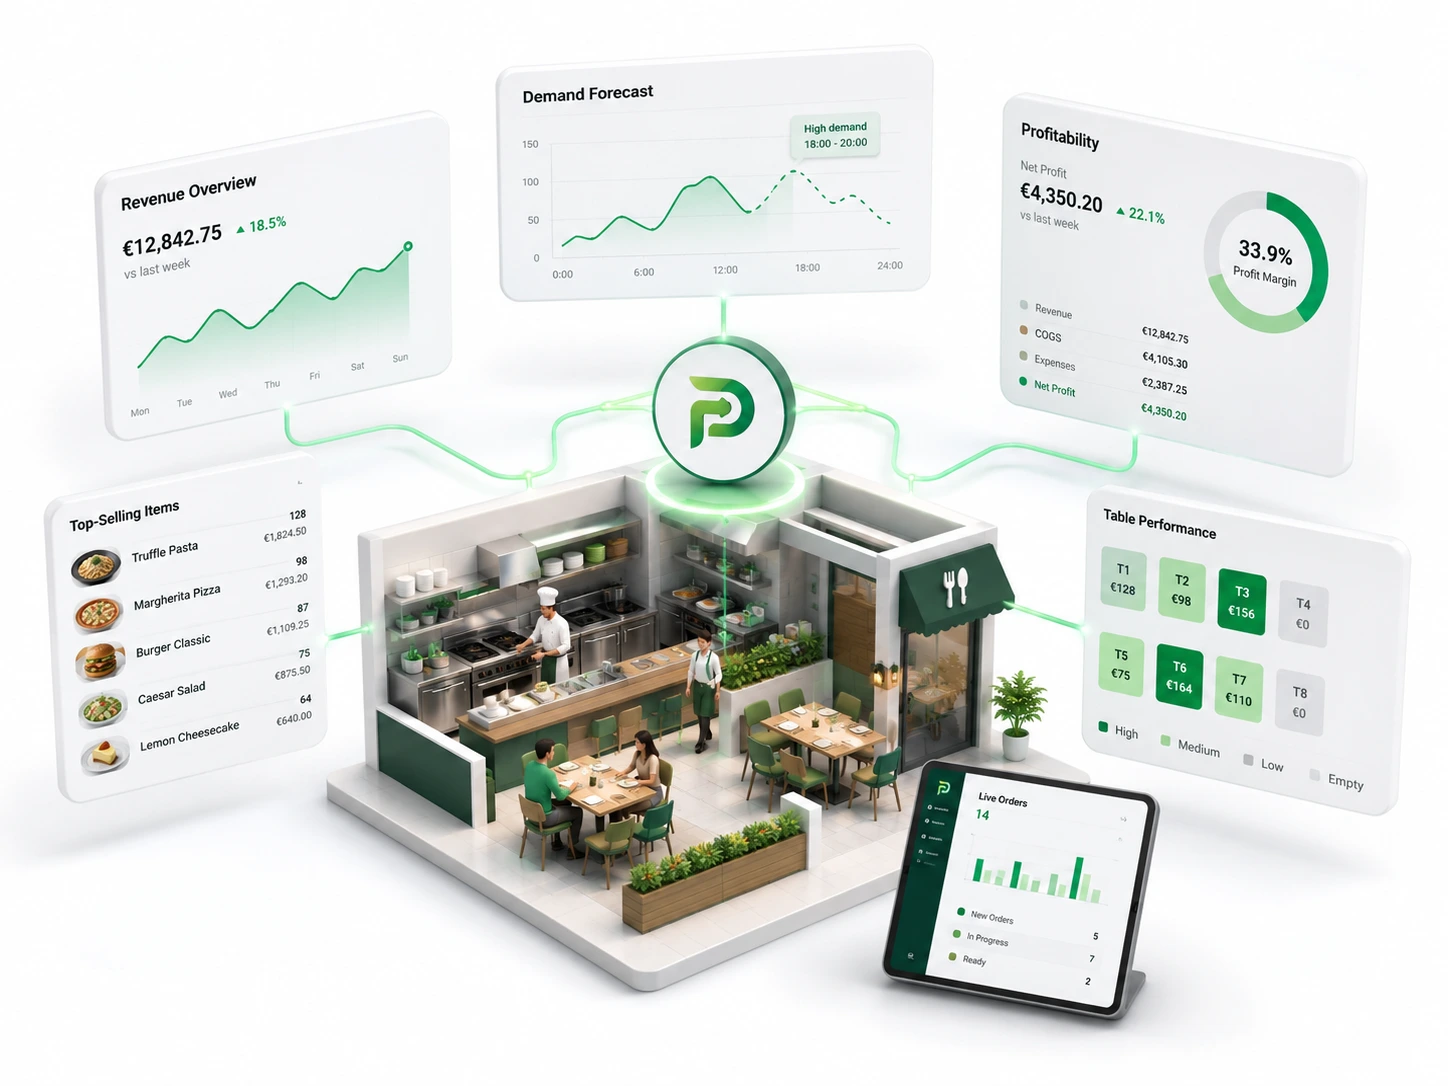
Compare revenue by period, service window, channel or location where the configured data supports it.
Track guest count or covers to explain demand and calculate spend per guest.
Calculate average check from revenue and guest count, then compare the result by period or location.
Review how many parties tables serve and how long tables remain in each service stage.
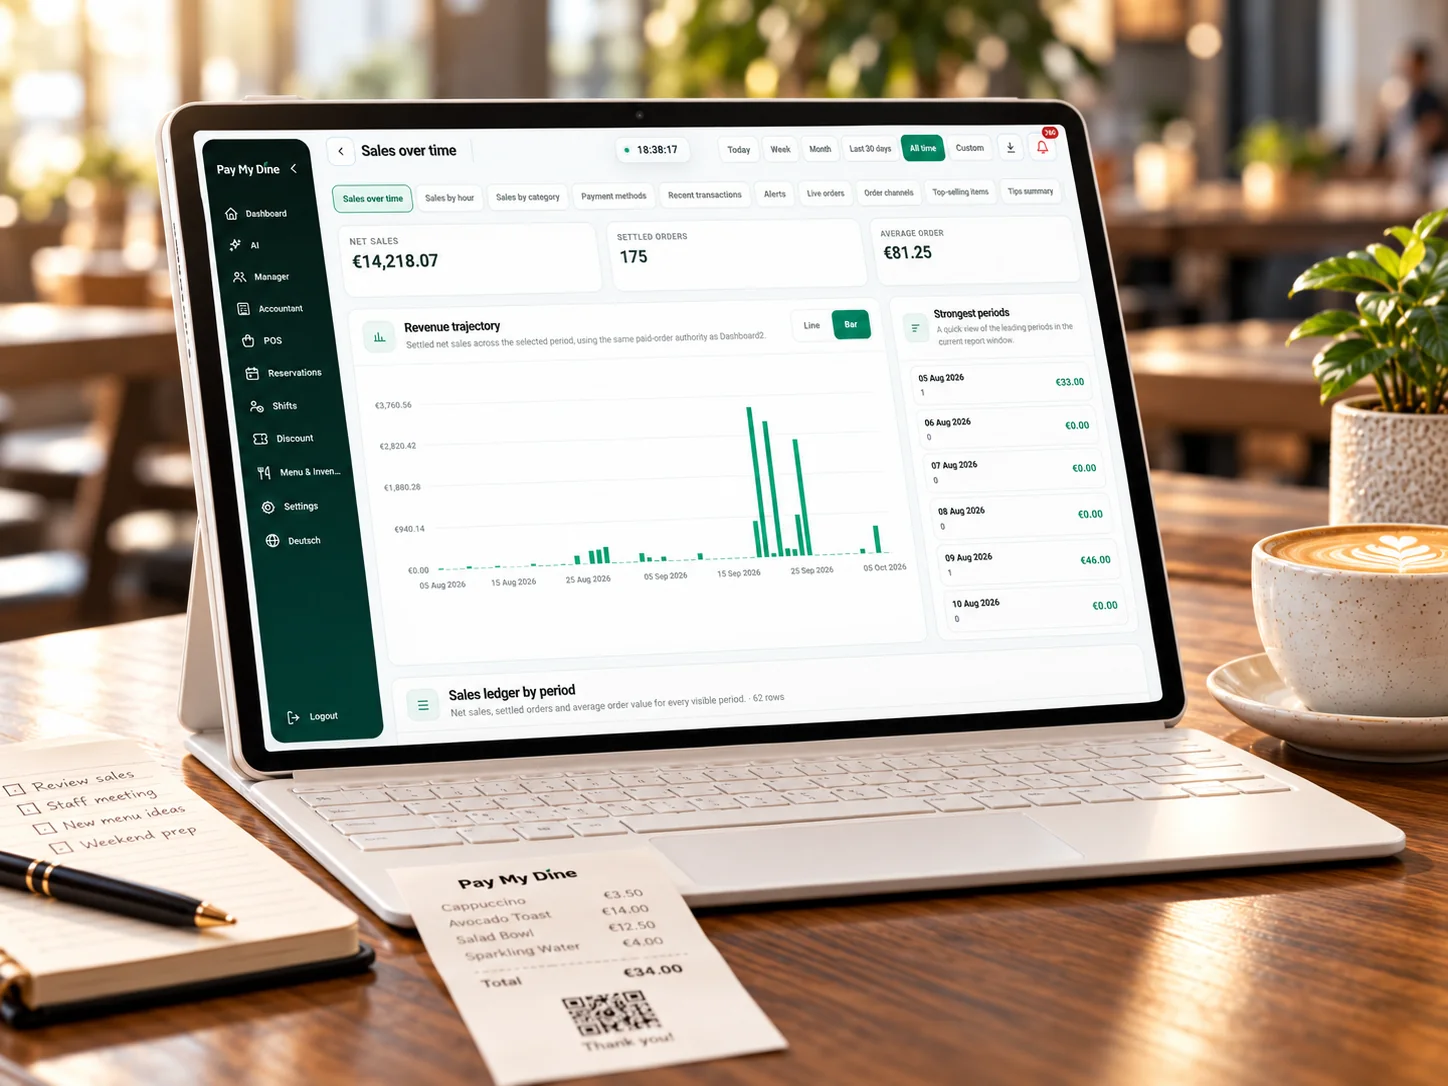
Read revenue and demand alongside order channels, guest activity, table performance, best sellers and payment mix.
See the 5-step operating flow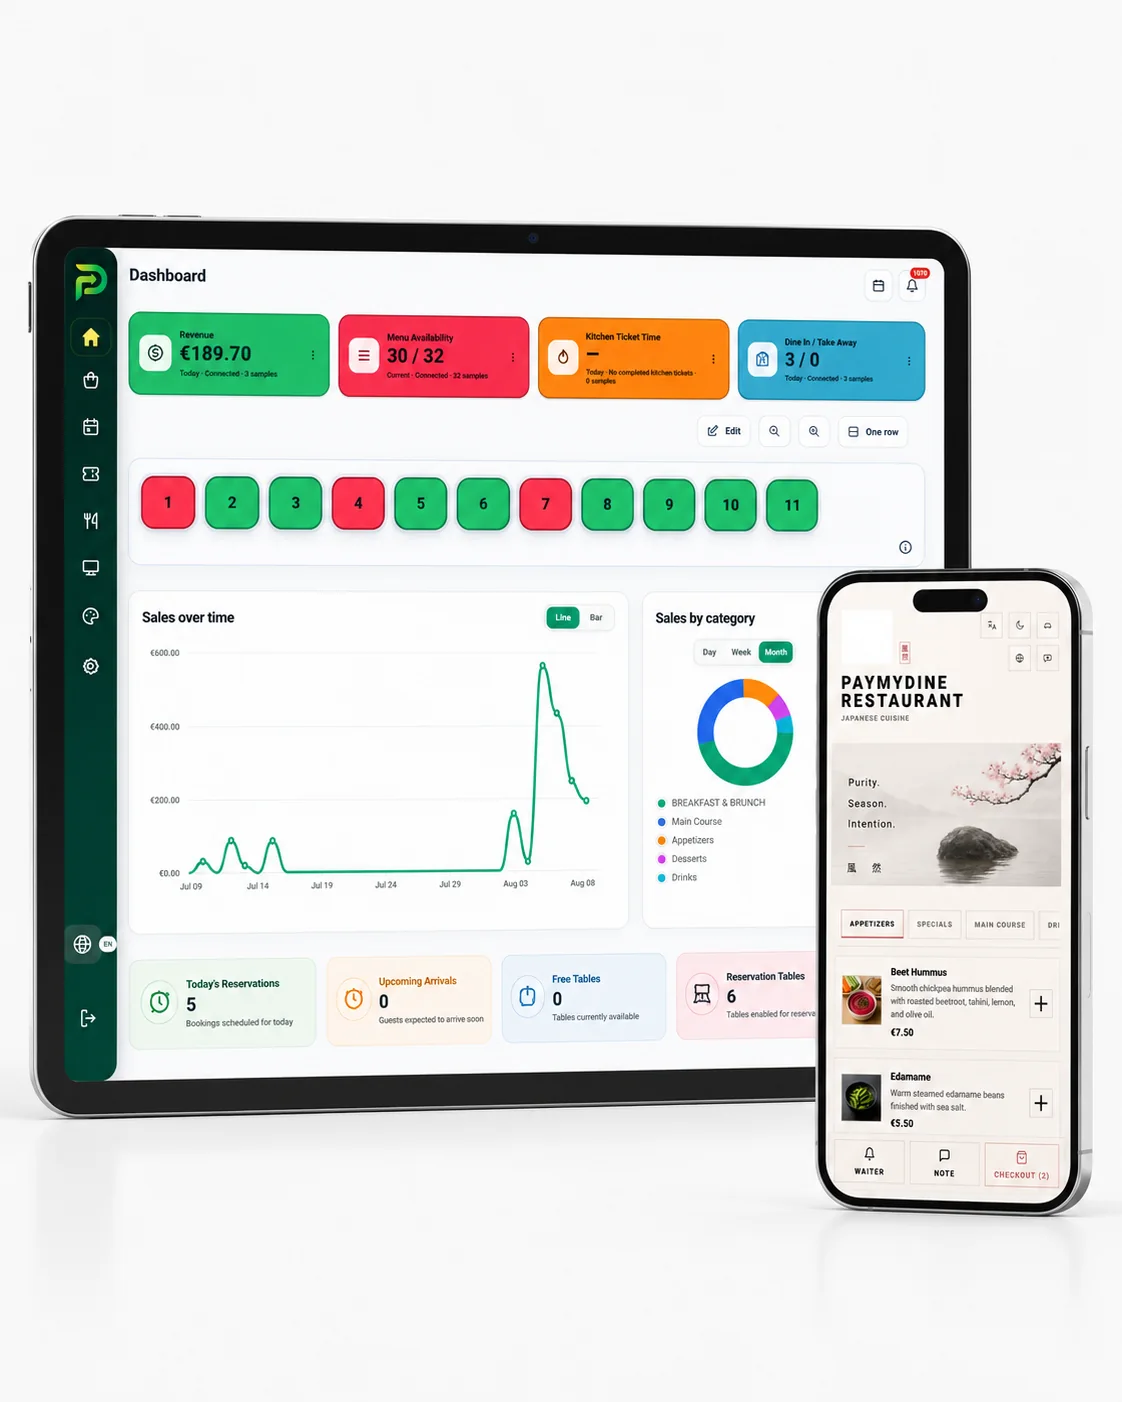
Use historical sales and demand patterns to support a forecast, then compare it with actual results and profitability by item or location.
See the 5-step operating flowReliable figures need clear definitions and sources.
Revenue, guests, average check, table turnover, sales timing, best sellers, payment mix, forecasting and profitability are included.
Profitability can be examined by item or location where the required cost and sales data is available.
Owner, manager, finance and operational leads read the same metrics for different decisions.
Period, location and order channel comparisons can explain movement behind a headline number.
Keep every summary linked to source records.
Orders, tables, guests, reservations and payments contribute the data available to the reporting environment.
Define periods, locations, channels, revenue treatment, covers and cost inputs before comparing results.
See current results and changes across the management metrics relevant to the configured modules.
Filter by period, location, channel, category or item to find the operating context behind the change.
Assign the next operational question or action, then compare the same metric definition in a later period.
Same numbers, different decisions.
Compares revenue, guest demand, location performance and profitability to decide where attention or investment is required.
Connects table, service and sales metrics to the operational events that shaped the shift.
Reviews revenue treatment, payment mix, categories, cost inputs and the reporting fields used outside operations.
Uses timing, best-seller and channel data to adjust service, menu or staffing decisions.
Features depend on available data and integrations.
Revenue, guest count and average check show the scale and value of demand during the selected period.
Table turnover and sales by time connect the commercial result to how the restaurant operated.
Best sellers and payment mix show what guests bought and how the table settled.
Forecasting plus profitability by item or location support forward planning when complete inputs are available.
Agree on sales, guest and cost definitions.
The exact answer can depend on the restaurant setup, selected modules and connected systems.
No reliable profitability figure can be produced without the required sales, item and cost inputs.
No. Forecasts are decision-support estimates that should be compared with actual results and reviewed by the team.
Yes, when location mappings and metric definitions are consistent across the selected sites.
AI can support summaries and investigation around available data, while the source views and human decision remain visible.
A metric should state its period, location, channels and source context so management can trace a change to the restaurant activity behind it.
We can show the signals behind revenue, guests, table performance, forecasting, best sellers and profitability by item or location.